本文介绍利用KDTree完成最邻近点间距的计算。
最邻近点间距(Nearest Neighbor Distance,NND)是一个能够反映信号点聚集情况的指标,文献中比较常见1 2 。
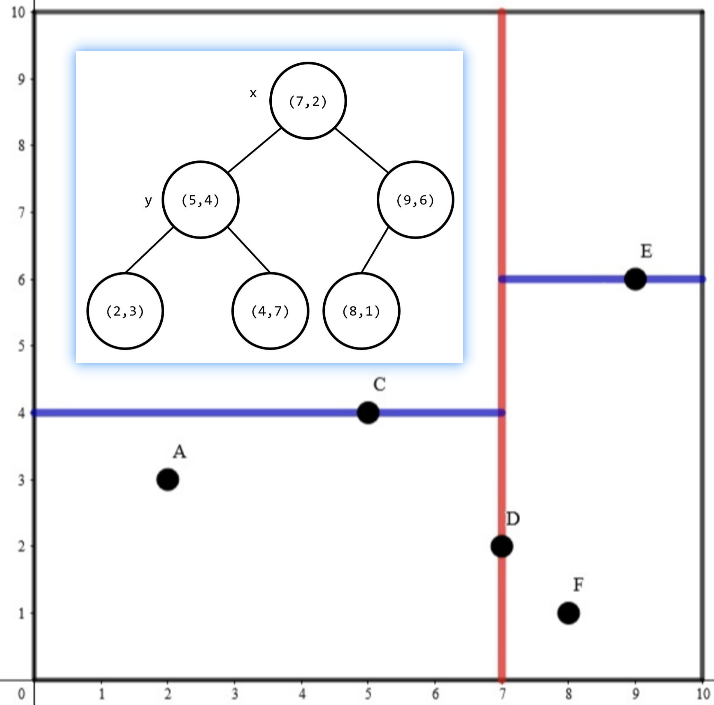
KDTree是一种可以高效处理维空间信息的数据结构,具有二叉搜索树的形态,在结点数n远大于维数时,应用 k-D Tree 的时间效率很好。而我们成像进行空间距离分析,一般就是二维或者三维,所以使用kdtree性价比很高。在python中,scipy就已经提供了封装好的 kdtree 方法,使用起来非常方便。
对三维颗粒质心NND的分析代码如下:
from glob import globimport pandas as pdimport numpy as npfrom scipy.spatial import KDTree
def get_nearest_distance(points, n_neighbors=1): '''计算最近邻间距离 points: dataframe对象,必须包含坐标信息,xyz三列都得有 n_neighbors: 要纳入统计的邻近点数量 ''' data = points.copy() locs = data.filter(items=['x', 'y', 'z']) tree = KDTree(locs) pids = np.array(locs.index) pidns = [] dists_mean = [] dists_sd = [] for idx in range(len(locs)): ploc = locs.iloc[idx] distances, inds = tree.query(ploc, k=1+n_neighbors) dist_mean = np.mean(distances[1:]) dist_sd = np.std(distances[1:]) dists_mean.append(dist_mean) dists_sd.append(dist_sd) ind = inds[1] pidn = pids[ind] pidns.append(pidn) data['Nearest Neighbor ID'] = pidns data[f'Nearest {n_neighbors} Neighbors Distance'] = dists_mean return data这段代码中,将输入数据中的坐标信息创建一个 KDTree,然后再遍历每一个质心,搜索距离它最近的点。搜索到之后,会把相应的距离汇总到一个新的表格中。如果指定搜索的邻近点数量大于一,而计算多个邻近点的平均值。
具体用例如下:
data = pd.read_csv("surface_pipeline_collection.csv", index_col=0)
data2 = get_nearest_distance(data, n_neighbors=2)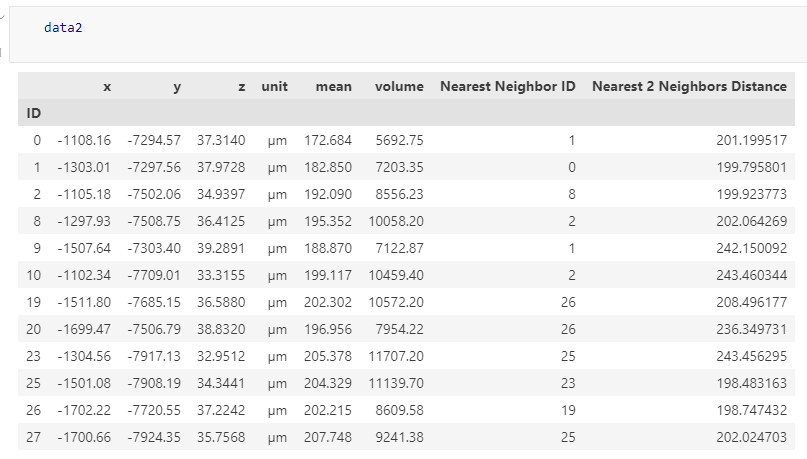
Footnotes
-
Quantitative single-protein imaging reveals molecular complex formation of integrin, talin, and kindlin during cell adhesion, Nature Communications, 2021. https://doi.org/10.1038/s41467-021-21142-2 ↩
-
Whole-cell imaging of plasma membrane receptors by 3D lattice light-sheet dSTORM, Nature Communications, 2020. https://doi.org/10.1038/s41467-020-14731-0 ↩