通过ImageJ得到的ROI可以尝试使用matplotlib进行更方便的可视化展示。
import roifilefrom glob import globimport matplotlib.pyplot as plt
def getImageFP(roi_fp): if roi_fp.endswith("_RoiSet.zip"): img_fp = roi_fp.replace("_RoiSet.zip", "") elif roi_fp.endswith("_rois.zip"): img_fp = roi_fp.replace("_rois.zip", ".png") return img_fp
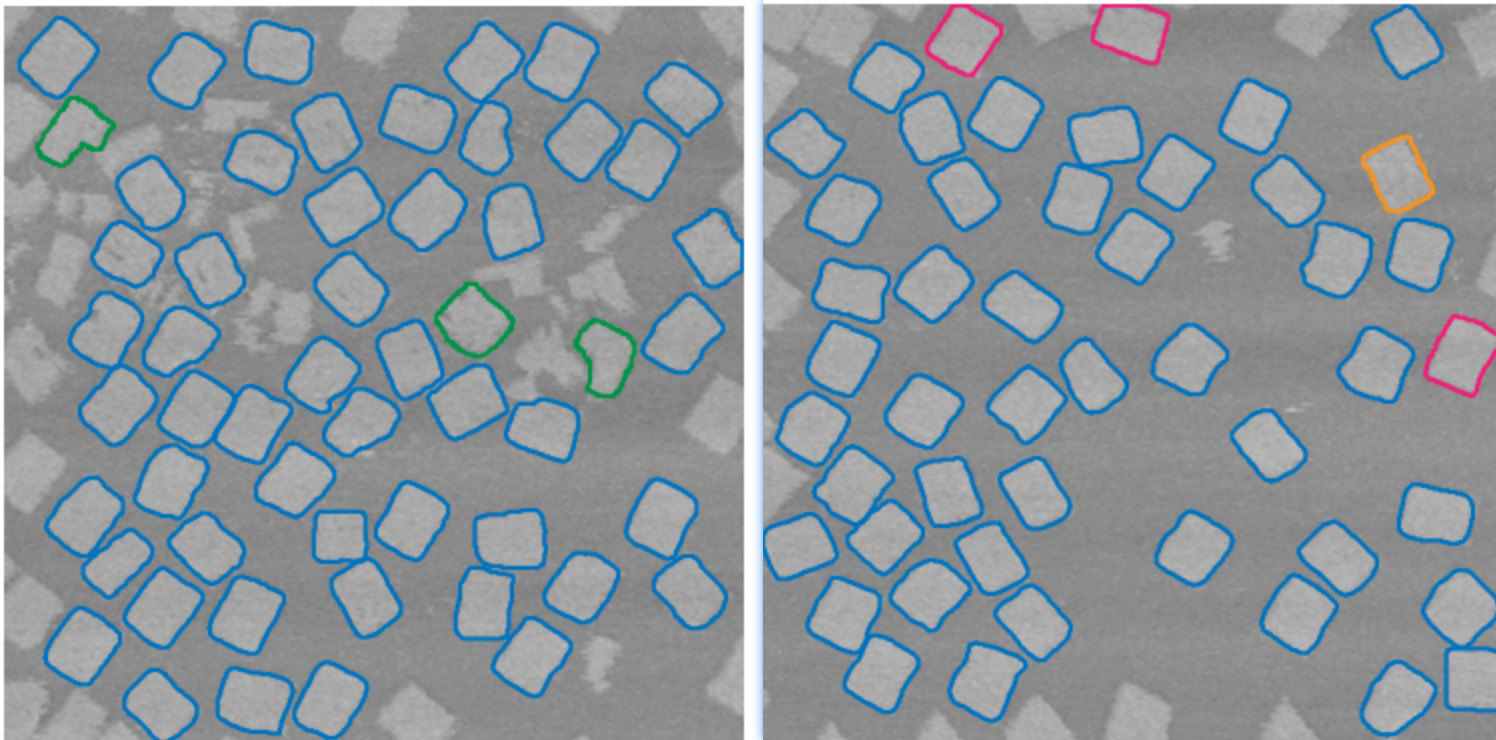
def main(roi_fp): box = roifile.roiread(roi_fp) img_fp = getImageFP(roi_fp) img = io.imread(img_fp) ecs = { 'add': '#ed1e79', 'modify':'#f7931e', 'delete':'#009245', 'detect': '#0071bc' } fig, ax = plt.subplots() ax.imshow(img, cmap="Greys_r", vmin=0, vmax=255) for item in box: if item.name in ecs: ec = ecs[item.name] else: ec = ecs['detect'] pts = item.coordinates() ax.fill(pts[:,0], pts[:,1], facecolor='none', edgecolor=ec, linewidth=1.5) ax.set_axis_off() plt.show()使用的时候很简单,输入路径即可:
wks = r'D:\desktop\data\'rois = glob(wks+"/*/*.zip")for roi_fp in rois: main(roi_fp)效果如下:
后来发现这个还挺常用的,需要进一步抽象更普通的ROI绘制函数,具体代码如下:
def plotROI(img_fp, roi_fp, color='#0071bc', linewidth=3): box = roifile.roiread(roi_fp) img = io.imread(img_fp) fig, ax = plt.subplots() ax.imshow(img, cmap="Greys_r", vmin=0, vmax=255) for item in box: pts = item.coordinates() ax.fill(pts[:,0], pts[:,1], facecolor='none', edgecolor=color, linewidth=linewidth) ax.set_axis_off() plt.tight_layout() plt.show()输入图像,还有对应的ROI记录,然后可以绘制ROI的轮廓线,可指定颜色和线宽。颜色可以使用 snipaste 复制 hexcode。绘制出来的图像可以复制粘贴走。