通过阈值分割图像中的前景和背景是成像数据分析中基础的基础。此处以skimage.filters.threshold_li函数为例,介绍基于最小交叉熵的图像阈值搜索算法。
虽然我们可以通过ImageJ预览图像的像素直方图,并结合目视检查的情况,人为设定一个比较合理的背景阈值。但这样做只适合于少量数据分析。
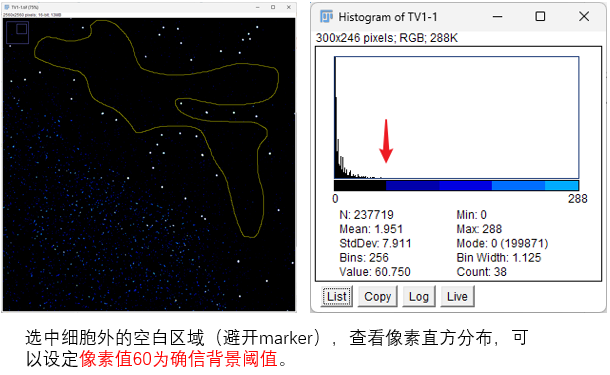
而且这样设定的阈值,依靠的是个人感官,所以只是一个估计值。所以为了阈值的设置更加科学,这里推荐使用以信息论为理论基础的 skimage.filters.threshold_li 来获得更准确的背景阈值。
这个函数通过多次迭代搜索阈值,每次迭代会计算原始图像和二值化图像之间的交叉熵,然后使这个交叉熵最小。
最小化交叉熵的直观意义在于,经过阈值分割后的图像(用类平均灰度表示)与原始图像在信息上的差异最小,从而保留了原始图像最多的重要信息,实现了最优的分割。
但需要注意,该方法容易陷入局部最优值,如果存在这种情况,可以尝试指定initial_guess(既可以是数值,也可以是自定义估计函数)。
为了更放心稳妥地使用这个函数,我查看了这个函数的源代码,发现:
-
如果不设置initial_guess, 默认第一次迭代时 t_next 为图像均值。
-
第一次迭代时 t_curr 最开始都是从负数开始的。
-
代码中并没有直接计算交叉熵,而是通过推导的公式来更新 t_next:
t_next = (mean_back - mean_fore) / (np.log(mean_back) - np.log(mean_fore))。这个让我看了直挠头,涉及到李氏方法。
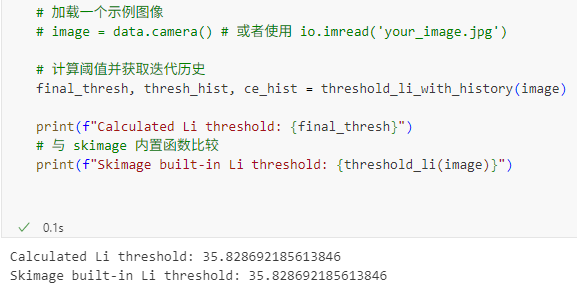
由于这个函数是通过迭代的过程搜索阈值,所以我想着能否将这个迭代的过程作图可视化,帮助我判断这个函数的运行机制。在AI的帮助下,让它修改这个函数的源代码,得到一个新的函数 threshold_li_with_history,我进行了一些测试。结果如下:
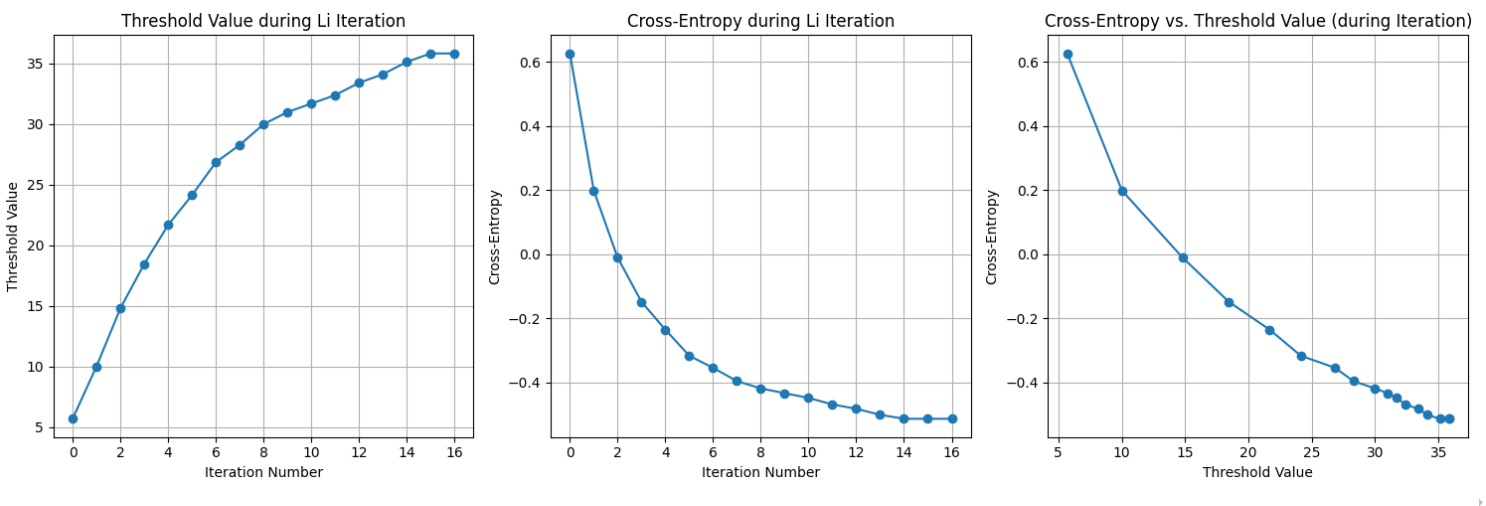
可以看到,交叉熵确实在下降,然后当前后两次交叉熵的差值小于设定的 tolerance 之后,搜索就结束了,函数范围当前的threshold。
能够收集阈值搜索迭代历史的函数源代码如下:
import numpy as np# 需要导入 histogram 函数,它通常来自 skimage.exposurefrom skimage.exposure import histogram
def threshold_li_with_history(image, *, tolerance=None, initial_guess=None, iter_callback=None): """Compute threshold value by Li's iterative Minimum Cross Entropy method, collecting thresholds and cross-entropies during iteration.
Parameters ---------- image : (M, N[, ...]) ndarray Grayscale input image. tolerance : float, optional Finish the computation when the change in the threshold in an iteration is less than this value. By default, this is half the smallest difference between intensity values in ``image``. initial_guess : float or Callable[[array[float]], float], optional Li's iterative method uses gradient descent to find the optimal threshold. If the image intensity histogram contains more than two modes (peaks), the gradient descent could get stuck in a local optimum. An initial guess for the iteration can help the algorithm find the globally-optimal threshold. A float value defines a specific start point, while a callable should take in an array of image intensities and return a float value. Example valid callables include ``numpy.mean`` (default), ``lambda arr: numpy.quantile(arr, 0.95)``, or even :func:`skimage.filters.threshold_otsu`. iter_callback : Callable[[float], Any], optional A function that will be called on the threshold at every iteration of the algorithm.
Returns ------- threshold : float Upper threshold value. All pixels with an intensity higher than this value are assumed to be foreground. thresholds_history : list of float A list containing the threshold value calculated at each iteration, including the initial guess threshold. cross_entropies_history : list of float A list containing the cross-entropy value calculated at each iteration, including the cross-entropy for the initial guess threshold. Note: Cross-entropy is calculated using the formula - (Pb*log(ub) + Pf*log(uf)), where Pb and Pf are probabilities of background and foreground, and ub and uf are their means.
References ---------- .. [1] Li C.H. and Lee C.K. (1993) "Minimum Cross Entropy Thresholding" Pattern Recognition, 26(4): 617-625 :DOI:`10.1016/0031-3203(93)90115-D` .. [2] Li C.H. and Tam P.K.S. (1998) "An Iterative Algorithm for Minimum Cross Entropy Thresholding" Pattern Recognition Letters, 18(8): 771-776 :DOI:`10.1016/S0167-8655(98)00057-9` .. [3] Sezgin M. and Sankur B. (2004) "Survey over Image Thresholding Techniques and Quantitative Performance Evaluation" Journal of Electronic Imaging, 13(1): 146-165 :DOI:`10.1117/1.1631315` .. [4] ImageJ AutoThresholder code, http://fiji.sc/wiki/index.php/Auto_Threshold
Examples -------- >>> from skimage.data import camera >>> image = camera() >>> thresh, thresh_hist, ce_hist = threshold_li_with_history(image) >>> print(f"Final threshold: {thresh}") >>> print(f"Threshold history (first 5): {thresh_hist[:5]}") >>> print(f"Cross-entropy history (first 5): {ce_hist[:5]}") """ # Remove nan: image = image[~np.isnan(image)] if image.size == 0: return np.nan, [], []
# Make sure image has more than one value; otherwise, return that value if np.all(image == image.flat[0]): val = float(image.flat[0]) # Return the single value as threshold, and empty history lists return val, [val], [np.nan] # CE is not well-defined for single value image
# At this point, the image only contains np.inf, -np.inf, or valid numbers image = image[np.isfinite(image)] if image.size == 0: # if there are no finite values in the image, return 0. This is because # at this point we *know* that there are *both* inf and -inf values, # because inf == inf evaluates to True. We might as well separate them. return 0.0, [0.0], [np.nan] # CE is not well-defined here either
# Li's algorithm requires positive image (because of log(mean)) # Store the minimum value to offset the threshold back at the end image_min = np.min(image) image_positive = image - image_min
if image_positive.dtype.kind in 'iu': tolerance = tolerance or 0.5 else: # Use float tolerance based on unique values difference unique_values = np.unique(image_positive) if unique_values.size > 1: tolerance = tolerance or np.min(np.diff(unique_values)) / 2 else: # If only one unique finite value after removing inf/nan, handle as single value case val = float(unique_values[0]) + image_min return val, [val], [np.nan]
# Initial estimate for iteration. See "initial_guess" in the parameter list if initial_guess is None: t_next = np.mean(image_positive) elif callable(initial_guess): # Apply initial guess function to the original image values (before offsetting) t_next_original_range = initial_guess(image) # Convert to the positive image range t_next = t_next_original_range - image_min elif np.isscalar(initial_guess): # Convert scalar initial guess to new, positive image range t_next = float(initial_guess) - float(image_min) # Check if initial guess is within the positive image range image_positive_max = np.max(image_positive) if not 0 < t_next < image_positive_max: # Also check edge cases where max is 0 (e.g., image was all image_min) if not (t_next == 0 and image_positive_max == 0): msg = ( f'The initial guess for threshold_li must be within the ' f'range of the image. Got {initial_guess} for image min ' f'{float(image_min)} and max {float(np.max(image))}.' ) raise ValueError(msg)
t_next = image_positive.dtype.type(t_next) # Cast back to appropriate type if needed else: raise TypeError( 'Incorrect type for `initial_guess`; should be ' 'a floating point value, or a function mapping an ' 'array to a floating point value.' )
# Initialize history lists thresholds_history = [] cross_entropies_history = []
# Calculate and store metrics for the initial guess threshold initial_t = t_next # The initial guess threshold in the positive range
# Helper function to calculate means, proportions, and CE def calculate_metrics(threshold_val, img_arr, is_integer_type, hist_data=None, bin_centers_data=None): if is_integer_type: hist, bin_centers = hist_data, bin_centers_data total_pixels = np.sum(hist) foreground_mask = bin_centers > threshold_val background_mask = ~foreground_mask n_back = np.sum(hist[background_mask]) n_fore = np.sum(hist[foreground_mask])
mean_back = np.average(bin_centers[background_mask], weights=hist[background_mask]) if n_back > 0 else 0.0 mean_fore = np.average(bin_centers[foreground_mask], weights=hist[foreground_mask]) if n_fore > 0 else 0.0
p_back = n_back / total_pixels if total_pixels > 0 else 0.0 p_fore = n_fore / total_pixels if total_pixels > 0 else 0.0
else: # float type total_pixels = img_arr.size foreground_mask = img_arr > threshold_val background_mask = ~foreground_mask n_back = np.sum(background_mask) n_fore = np.sum(foreground_mask)
mean_back = np.mean(img_arr[background_mask]) if n_back > 0 else 0.0 mean_fore = np.mean(img_arr[foreground_mask]) if n_fore > 0 else 0.0
p_back = n_back / total_pixels if total_pixels > 0 else 0.0 p_fore = n_fore / total_pixels if total_pixels > 0 else 0.0
cross_entropy = np.nan # Default if means are zero or regions are empty
# Calculate cross-entropy only if means are positive and regions exist # Check if proportions are positive to avoid log(0) indirectly via means if mean_back > 0 and mean_fore > 0 and p_back > 0 and p_fore > 0: cross_entropy = -(p_back * np.log(mean_back) + p_fore * np.log(mean_fore)) # Handle case where a region has pixels but mean is exactly zero (unlikely with float, possible with int 0) # If mean is 0 but p > 0, log(mean) is -inf, term goes to inf. # The original algorithm breaks if mean_back is 0. Let's be consistent. # If any mean is zero, we consider CE infinite or undefined in this context and break the iteration. # For history, we store NaN if means are zero.
return mean_back, mean_fore, p_back, p_fore, cross_entropy, n_back, n_fore
# Calculate and store initial metrics is_integer = image_positive.dtype.kind in 'iu' hist_data, bin_centers_data = (None, None) if is_integer: hist_data, bin_centers_data = histogram(image_positive.reshape(-1), source_range='image') hist_data = hist_data.astype('float64', copy=False) # Use float64 for weights
mean_back_init, mean_fore_init, p_back_init, p_fore_init, initial_cross_entropy, n_back_init, n_fore_init = \ calculate_metrics(initial_t, image_positive, is_integer, hist_data, bin_centers_data)
# Store initial guess metrics # Only store CE if means were positive, otherwise it's NaN thresholds_history.append(initial_t + image_min) cross_entropies_history.append(initial_cross_entropy)
# Call callback for the initial guess threshold if iter_callback is not None: iter_callback(initial_t + image_min)
# initial value for t_curr must be different from t_next by at # least the tolerance. Since the image is positive, we ensure this # by setting to a large-enough negative number relative to t_next t_curr = initial_t - 2 * tolerance t_next = initial_t # Start the loop check with the initial guess
# Stop the iterations when the difference between the # new and old threshold values is less than the tolerance # or if the background/foreground mode has only one value left or a mean is zero.
while abs(t_next - t_curr) > tolerance: t_curr = t_next # t_curr is now the threshold from the end of the previous iteration
# Calculate the NEXT threshold based on t_curr (the previous threshold) # Need to use the current threshold (t_curr) to split the image/histogram if is_integer: foreground_curr = bin_centers_data > t_curr background_curr = ~foreground_curr n_back_curr = np.sum(hist_data[background_curr]) n_fore_curr = np.sum(hist_data[foreground_curr])
# Break conditions based on regions becoming empty if n_back_curr == 0 or n_fore_curr == 0: break
mean_back_curr = np.average(bin_centers_data[background_curr], weights=hist_data[background_curr]) mean_fore_curr = np.average(bin_centers_data[foreground_curr], weights=hist_data[foreground_curr])
# Break conditions based on means being zero (log(0) is undefined) if mean_back_curr == 0 or mean_fore_curr == 0: break
# Calculate the new threshold (t_next) # This calculation is based on the means derived from t_curr t_next = (mean_back_curr - mean_fore_curr) / (np.log(mean_back_curr) - np.log(mean_fore_curr))
else: # float image foreground_curr = image_positive > t_curr background_curr = ~foreground_curr n_back_curr = np.sum(background_curr) n_fore_curr = np.sum(foreground_curr)
# Break conditions based on regions becoming empty if n_back_curr == 0 or n_fore_curr == 0: break
mean_fore_curr = np.mean(image_positive[foreground_curr]) mean_back_curr = np.mean(image_positive[background_curr])
# Break conditions based on means being zero if mean_back_curr == 0.0 or mean_fore_curr == 0.0: break
# Calculate the new threshold (t_next) t_next = (mean_back_curr - mean_fore_curr) / (np.log(mean_back_curr) - np.log(mean_fore_curr))
# --- End of calculating t_next for this iteration ---
# Calculate cross-entropy FOR the newly calculated t_next # We need means and proportions based on the *new* t_next mean_back_next, mean_fore_next, p_back_next, p_fore_next, cross_entropy, n_back_next, n_fore_next = \ calculate_metrics(t_next, image_positive, is_integer, hist_data, bin_centers_data)
# Check break conditions again based on metrics calculated with t_next # This handles cases where the new threshold splits the image in a way that leads to empty/zero mean regions if n_back_next == 0 or n_fore_next == 0 or mean_back_next == 0 or mean_fore_next == 0: # If breaking due to this, the last calculated t_next and CE might be invalid. # Let's remove the last appended values before breaking. # However, the original loop structure means we calculated t_next successfully in the step. # If the *evaluation* at t_next fails, it means this t_next is problematic. # The previous t_curr was the last 'good' threshold. # Let's append the problematic t_next and NaN for CE and then break. # This shows the iteration step where it failed. thresholds_history.append(t_next + image_min) cross_entropies_history.append(np.nan) # Indicate invalid CE if iter_callback is not None: iter_callback(t_next + image_min) break # Break the while loop
# Store the newly calculated threshold and its corresponding cross-entropy # Only store CE if it's not NaN (i.e., means were positive) thresholds_history.append(t_next + image_min) cross_entropies_history.append(cross_entropy)
# Callback on the newly calculated threshold for this iteration if iter_callback is not None: iter_callback(t_next + image_min)
# Final threshold is the last calculated t_next threshold = t_next + image_min
return threshold, thresholds_history, cross_entropies_history绘制阈值搜索迭代历史的可视化代码如下:
# 绘制迭代过程中的阈值和交叉熵曲线plt.figure(figsize=(15, 5))
# 绘制阈值随迭代次数的变化plt.subplot(1, 3, 1)plt.plot(thresh_hist, marker='o', linestyle='-')plt.xlabel('Iteration Number')plt.ylabel('Threshold Value')plt.title('Threshold Value during Li Iteration')plt.grid(True)
# 绘制交叉熵随迭代次数的变化plt.subplot(1, 3, 2)plt.plot(ce_hist, marker='o', linestyle='-')plt.xlabel('Iteration Number')plt.ylabel('Cross-Entropy')plt.title('Cross-Entropy during Li Iteration')plt.grid(True)
# 绘制交叉熵随阈值变化的曲线 (基于迭代过程中的记录)plt.subplot(1, 3, 3)plt.plot(thresh_hist, ce_hist, marker='o', linestyle='-')plt.xlabel('Threshold Value')plt.ylabel('Cross-Entropy')plt.title('Cross-Entropy vs. Threshold Value (during Iteration)')plt.grid(True)
plt.tight_layout()plt.show()