对于很小的信号点比如单分子光斑,或者是单分子定位的散点cluster,我们可以忽略其本身的体积,视作质点来计算。这样可以计算质点之间的最邻近距离(Nearest Neighborhood Distance, NND),此时使用KDTree可以很好的解决问题。但是当信号是一个区域的时候,如果再使用NND,则单个cluster区域较大计算的质心NND就无法体现其分布聚集程度了。此时另外一个single particle level 的 metric 就是最小间隙长度。这是一个经典的“最近点对”问题,即寻找两个cluster中相邻最近的一对点。
都已经2025年了,谁还自己从头写代码啊。在 gemini 2.5 flash 的帮助下,我很快完成了这个功能的开发。首先我把自己的需求按照函数文档的框架组织好后告诉AI。这种写代码的方式我称之为函数文档式编程。
我有一个三维的成像数据,已经做好了图像分割,得到了它的label图像,label为0的是背景,label大于0时是分割后对象的索引标签。现在要计算每个对象的最邻近距离。注意这里的最邻近距离是两个对象轮廓边界之间的最小间隙长度,而不是两个对象的几何中心的直线距离。把这个功能写成一个python函数,输入的就是 mask.tif,这个mask.tif 使用 skimage模块读取,然后输出的是一张pd.DataFrame,其中包含了以下列:1. label: 表示分割对象的标签或索引,注意排除02. xc: 对象几何中心的x位置,注意 mask.tif 读取后的shape是(z, y, x)3. yc: 对象几何中心的y位置4. zc: 对应几何中心的z位置5. d: 与该对象最邻近的(即间隙长度最小时)对象间隙长度6. label2: 最邻近对象的label7. xc2: 最邻近对象几何中心的x位置8. yc2: 最邻近对象几何中心的y位置9. zc2: 最邻近对象几何中心的z位置10. xe1: 和最邻近对象间隙最短连线与该对象边界交点x坐标11. ye1: 和最邻近对象间隙最短连线与该对象边界交点y坐标12. ze1: 和最邻近对象间隙最短连线与该对象边界交点z坐标13. xe2: 和最邻近对象间隙最短连线与最邻近对象边界交点x坐标14. ye2: 和最邻近对象间隙最短连线与最邻近对象边界交点y坐标15. ze2: 和最邻近对象间隙最短连线与最邻近对象边界交点z坐标AI很快就给我生成了可用的函数,并且附带了一个简单的测试案例,但是我觉得测试案例过于粗糙,不便于我检验。所以我又继续对测试代码的可视化部分功能提出要求:
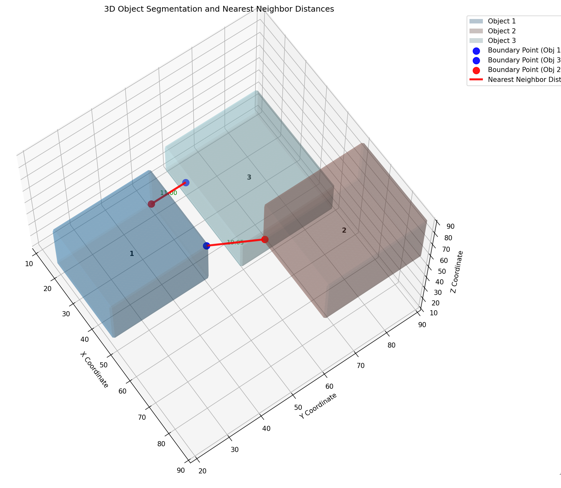
请给上述代码中的示例补充三维作图可视化以便于我检验函数功能是否正确。要求:1. 不同的对象使用不同的颜色,并添加其label作为文字标注。2. 对象绘制绘制surface而不是散点,且surface要半透明。3. 绘制最短间隙的连线。AI又增加了可视化的函数,我看了下效果,虽然细节上有些问题,我对示例数据稍作修改,就充分满足了此次的分析需求。效果如下:
经过整理的完整代码如下:
import numpy as npimport pandas as pdfrom skimage import io, measure, morphologyfrom scipy.ndimage import distance_transform_edtfrom tqdm import tqdmimport matplotlib.pyplot as pltfrom mpl_toolkits.mplot3d.art3d import Line3DCollectionimport matplotlib.colors as mcolors
def calculate_nearest_neighbor_distance_3d(mask_filepath: str) -> pd.DataFrame: """ 计算三维图像中每个分割对象的最邻近距离。 最邻近距离是两个对象轮廓边界之间的最小间隙长度。
Args: mask_filepath (str): mask.tif 文件的路径,使用 skimage 读取。 mask.tif 读取后的 shape 是 (z, y, x)。
Returns: pd.DataFrame: 包含以下列的 DataFrame: - label: 分割对象的标签或索引 (排除0) - xc: 对象几何中心的x位置 - yc: 对象几何中心的y位置 - zc: 对象几何中心的z位置 - d: 与该对象最邻近的(即间隙长度最小时)对象间隙长度 - label2: 最邻近对象的label - xc2: 最邻近对象几何中心的x位置 - yc2: 最邻近对象几何中心的y位置 - zc2: 最邻近对象几何中心的z位置 - xe1: 和最邻近对象间隙最短连线与该对象边界交点x坐标 - ye1: 和最邻近对象间隙最短连线与该对象边界交点y坐标 - ze1: 和最邻近对象间隙最短连线与该对象边界交点z坐标 - xe2: 和最邻近对象间隙最短连线与最邻近对象边界交点x坐标 - ye2: 和最邻近对象间隙最短连线与最邻近对象边界交点y坐标 - ze2: 和最邻近对象间隙最短连线与最邻近对象边界交点z坐标 """ mask = io.imread(mask_filepath)
# 获取所有对象的属性 # 注意 regionprops 质心返回 (row, col, plane) 即 (z, y, x) properties = measure.regionprops(mask)
results = []
# 提取所有对象的label labels = [prop.label for prop in properties if prop.label != 0]
# 创建一个包含所有边界像素的字典,以便快速查找 # {label: set_of_boundary_coordinates} all_boundaries = {} for prop in properties: if prop.label == 0: continue # 使用 morphology.binary_erosion 来找到边界 object_mask = (mask == prop.label) eroded_mask = morphology.binary_erosion(object_mask) boundary = object_mask ^ eroded_mask # XOR operation to get boundary
# 获取边界像素的坐标 boundary_coords = np.argwhere(boundary) all_boundaries[prop.label] = set(tuple(coord) for coord in boundary_coords)
# 遍历每个对象 for prop1 in tqdm(properties, desc="Processing objects"): label1 = prop1.label if label1 == 0: # 排除背景 continue
zc1, yc1, xc1 = prop1.centroid
min_distance = float('inf') nearest_label2 = -1 nearest_xc2, nearest_yc2, nearest_zc2 = -1, -1, -1 nearest_xe1, nearest_ye1, nearest_ze1 = -1, -1, -1 nearest_xe2, nearest_ye2, nearest_ze2 = -1, -1, -1
# 为当前对象创建一个二值掩码 object1_mask = (mask == label1)
# 创建一个包含所有其他对象的掩码 other_objects_mask = np.zeros_like(mask, dtype=bool) for prop2 in properties: if prop2.label != 0 and prop2.label != label1: other_objects_mask[mask == prop2.label] = True
# 计算所有其他对象到背景的距离变换 # 这里的距离变换是计算每个像素到最近的other_objects_mask前景像素的距离 # 这样,在 object1_mask 的边界上,我们可以找到离其他对象最近的点 if np.any(other_objects_mask): distance_to_others = distance_transform_edt(~other_objects_mask) else: # 没有其他对象,所有距离都为无穷大 distance_to_others = np.full(mask.shape, np.inf)
# 获取 object1_mask 的边界 eroded_object1_mask = morphology.binary_erosion(object1_mask) object1_boundary = object1_mask ^ eroded_object1_mask
# 找到 object1_boundary 上距离 distance_to_others 最小的点 boundary_coords_object1 = np.argwhere(object1_boundary)
if len(boundary_coords_object1) > 0: # 获取 object1 边界上每个点的距离值 distances_on_boundary = distance_to_others[object1_boundary]
if len(distances_on_boundary) > 0: min_distance_idx = np.argmin(distances_on_boundary) current_min_distance = distances_on_boundary[min_distance_idx]
if current_min_distance < min_distance: min_distance = current_min_distance
# 找到 object1_boundary 上距离最近的点 (ze1, ye1, xe1) ze1, ye1, xe1 = boundary_coords_object1[min_distance_idx]
# 遍历所有其他对象的边界点,找到与 (ze1, ye1, xe1) 距离最近的那个 min_dist_to_xe1_ye1_ze1 = float('inf')
for prop2 in properties: label2_candidate = prop2.label if label2_candidate == 0 or label2_candidate == label1: continue
# 遍历 label2_candidate 的边界像素 for z2, y2, x2 in all_boundaries[label2_candidate]: dist_squared = (x2 - xe1)**2 + (y2 - ye1)**2 + (z2 - ze1)**2 if dist_squared < min_dist_to_xe1_ye1_ze1**2: min_dist_to_xe1_ye1_ze1 = np.sqrt(dist_squared) nearest_label2 = label2_candidate nearest_ze2, nearest_ye2, nearest_xe2 = z2, y2, x2 # 更新中心点 nearest_zc2, nearest_yc2, nearest_xc2 = prop2.centroid
results.append({ 'label': label1, 'xc': xc1, 'yc': yc1, 'zc': zc1, 'd': min_distance, 'label2': nearest_label2, 'xc2': nearest_xc2, 'yc2': nearest_yc2, 'zc2': nearest_zc2, 'xe1': xe1, 'ye1': ye1, 'ze1': ze1, 'xe2': nearest_xe2, 'ye2': nearest_ye2, 'ze2': nearest_ze2 })
return pd.DataFrame(results)
def visualize_3d_segmentation(mask_filepath: str, df_results: pd.DataFrame): """ 可视化三维分割对象和它们之间的最短间隙连线。 对象以半透明表面形式绘制。
Args: mask_filepath (str): mask.tif 文件的路径。 df_results (pd.DataFrame): 由 calculate_nearest_neighbor_distance_3d 函数返回的结果 DataFrame。 """ mask = io.imread(mask_filepath) labels = np.unique(mask) labels = labels[labels != 0] # 排除背景
fig = plt.figure(figsize=(12, 10)) ax = fig.add_subplot(111, projection='3d')
# 生成颜色映射,确保不同的label有不同的颜色 # 使用 'tab20' 或 'tab20b', 'tab20c' 等,因为它们提供更多离散颜色 # 如果对象数量超过20个,可能需要自定义颜色列表或使用HSV颜色空间 cmap = plt.cm.get_cmap('tab20', len(labels))
# 绘制每个对象为半透明表面 for i, label in enumerate(labels): object_mask = (mask == label)
# 使用 marching_cubes 从二值掩码生成表面 # level 参数可以调整,通常取0.5对于二值图像即可 # spacing 可以用于非各向同性体素,这里假设是1:1:1 try: verts, faces, normals, values = measure.marching_cubes(object_mask, level=0.5, spacing=(1,1,1)) except ValueError as e: # 如果对象太小或形状不规则,marching_cubes 可能无法生成表面 print(f"Warning: Could not generate surface for object {label}. Error: {e}") continue
# marching_cubes 返回的顶点坐标是 (z, y, x) 顺序,需要转换为 (x, y, z) # 加上对象的原点偏移量 # z_offset, y_offset, x_offset = np.min(np.argwhere(object_mask), axis=0) z_offset, y_offset, x_offset = 0,0,0 x_verts = verts[:, 2] + x_offset y_verts = verts[:, 1] + y_offset z_verts = verts[:, 0] + z_offset
ax.plot_trisurf(x_verts, y_verts, z_verts, triangles=faces, color=cmap(i), alpha=0.3, # 设置半透明度 edgecolor='none', label=f'Object {label}') # 不绘制边缘线
# 添加label文字标注到对象的几何中心 row_filtered = df_results[df_results['label'] == label] if not row_filtered.empty: row = row_filtered.iloc[0] ax.text(row['xc'], row['yc'], row['zc'], str(label), color='black', fontsize=10, ha='center', va='center', weight='bold')
# 绘制最短间隙的连线 lines = [] line_labels = set() # 用于确保每条最短连线只被添加一次图例 for _, row in df_results.iterrows(): # 只有当存在最邻近对象且距离不为无穷大时才绘制连线 if row['label2'] != -1 and row['d'] != float('inf'): # 确保每个最短距离只绘制一次,例如,如果1到2的最短距离被计算,则2到1的不再重复绘制 sorted_labels = tuple(sorted((row['label'], row['label2']))) if sorted_labels not in line_labels: line_labels.add(sorted_labels)
# 连线从对象1的边界交点到对象2的边界交点 point1 = (row['xe1'], row['ye1'], row['ze1']) point2 = (row['xe2'], row['ye2'], row['ze2']) lines.append([point1, point2])
# 在交点处绘制小球 # 使用唯一的label来确保图例不重复 label_p1 = f'Boundary Point (Obj {row["label"]})' if sorted_labels == list(line_labels)[0] else "" label_p2 = f'Boundary Point (Obj {row["label2"]})' if sorted_labels == list(line_labels)[0] else ""
ax.scatter(row['xe1'], row['ye1'], row['ze1'], color='red', marker='o', s=100, alpha=0.9, label=label_p1) ax.scatter(row['xe2'], row['ye2'], row['ze2'], color='blue', marker='o', s=100, alpha=0.9, label=label_p2)
# 标注距离 mid_x = (row['xe1'] + row['xe2']) / 2 mid_y = (row['ye1'] + row['ye2']) / 2 mid_z = (row['ze1'] + row['ze2']) / 2 ax.text(mid_x, mid_y, mid_z, f'{row["d"]:.2f}', color='green', fontsize=9, ha='center', va='center')
if len(lines) > 0: lc = Line3DCollection(lines, colors='red', linewidths=3, alpha=0.9, label='Nearest Neighbor Distance Line') ax.add_collection(lc)
# 设置轴范围,以确保所有对象都在视图中 all_x = [] all_y = [] all_z = [] for prop in measure.regionprops(mask): if prop.label != 0: coords = prop.coords all_z.extend(coords[:, 0]) all_y.extend(coords[:, 1]) all_x.extend(coords[:, 2])
if all_x and all_y and all_z: min_x, max_x = np.min(all_x), np.max(all_x) min_y, max_y = np.min(all_y), np.max(all_y) min_z, max_z = np.min(all_z), np.max(all_z)
# 添加一些边距 margin = 2 ax.set_xlim(min_x - margin, max_x + margin) ax.set_ylim(min_y - margin, max_y + margin) ax.set_zlim(min_z - margin, max_z + margin)
ax.set_xlabel('X Coordinate') ax.set_ylabel('Y Coordinate') ax.set_zlabel('Z Coordinate') ax.set_title('3D Object Segmentation and Nearest Neighbor Distances')
# 调整图例位置,避免遮挡 handles, labels = ax.get_legend_handles_labels() unique_labels = {} for handle, label in zip(handles, labels): unique_labels[label] = handle ax.legend(unique_labels.values(), unique_labels.keys(), loc='upper left', bbox_to_anchor=(1.05, 1), borderaxespad=0.)
plt.tight_layout() plt.show()
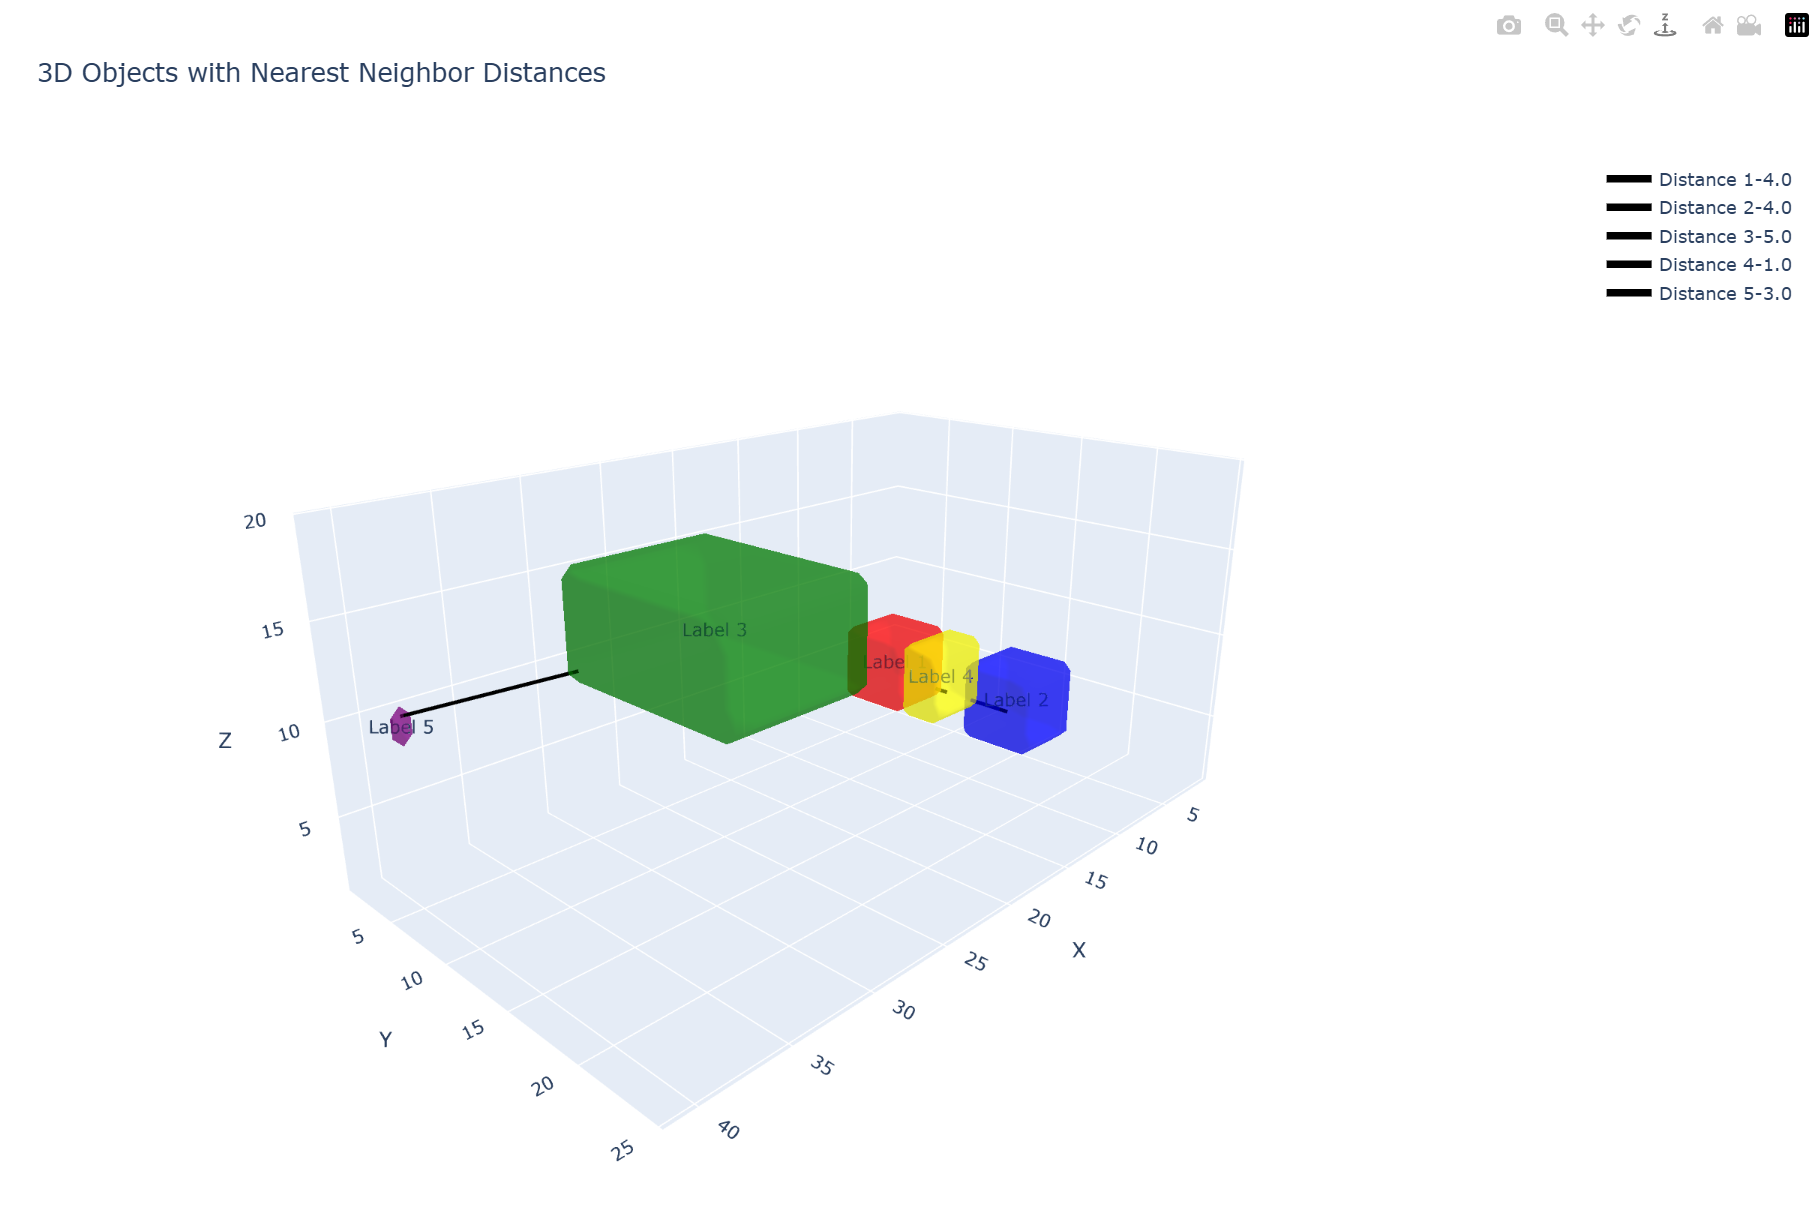
if __name__ == '__main__': # 示例用法: # 创建一个虚拟的 mask.tif 文件用于测试 dummy_mask = np.zeros((100, 100, 100), dtype=np.uint16)
# 添加一些对象 # 对象1 dummy_mask[20:50, 20:50, 20:50] = 1 # 3x3x3 体积 # 对象2, 靠近对象1 dummy_mask[60:90, 60:90, 60:90] = 2 # 3x3x3 体积 # 对象3, 离对象1和2都较远 dummy_mask[10:30, 60:90, 10:50] = 3 # 2x3x4 体积
# 保存为 tif 文件 test_mask_filepath = 'dummy_mask.tif' io.imsave(test_mask_filepath, dummy_mask)
# 调用函数计算最邻近距离 df_results = calculate_nearest_neighbor_distance_3d(test_mask_filepath) print("Nearest Neighbor Distance Results:") print(df_results)
# 可视化结果 visualize_3d_segmentation(test_mask_filepath, df_results)看到这个AI(Gemini 2.5 Flash)现在这么强,我又继续尝试了其它一些AI,发现Gemini-2.5 Pro 也能生成满足需求的函数代码,但是思考时间太长。然后 Grok表现是让我最满意的,不仅代码看上去很简洁,而且三维可视化的时候效果更好(如下图)。但可惜的是,国内的 Qwen 和 Deepseek 生成的代码都是无法运行的。