在grok的帮助下利用plotly打造了一个简单的双通道成像预览函数。这样可以方便集成到数据分析工作流程中,以便实时交互以快速检验情况。
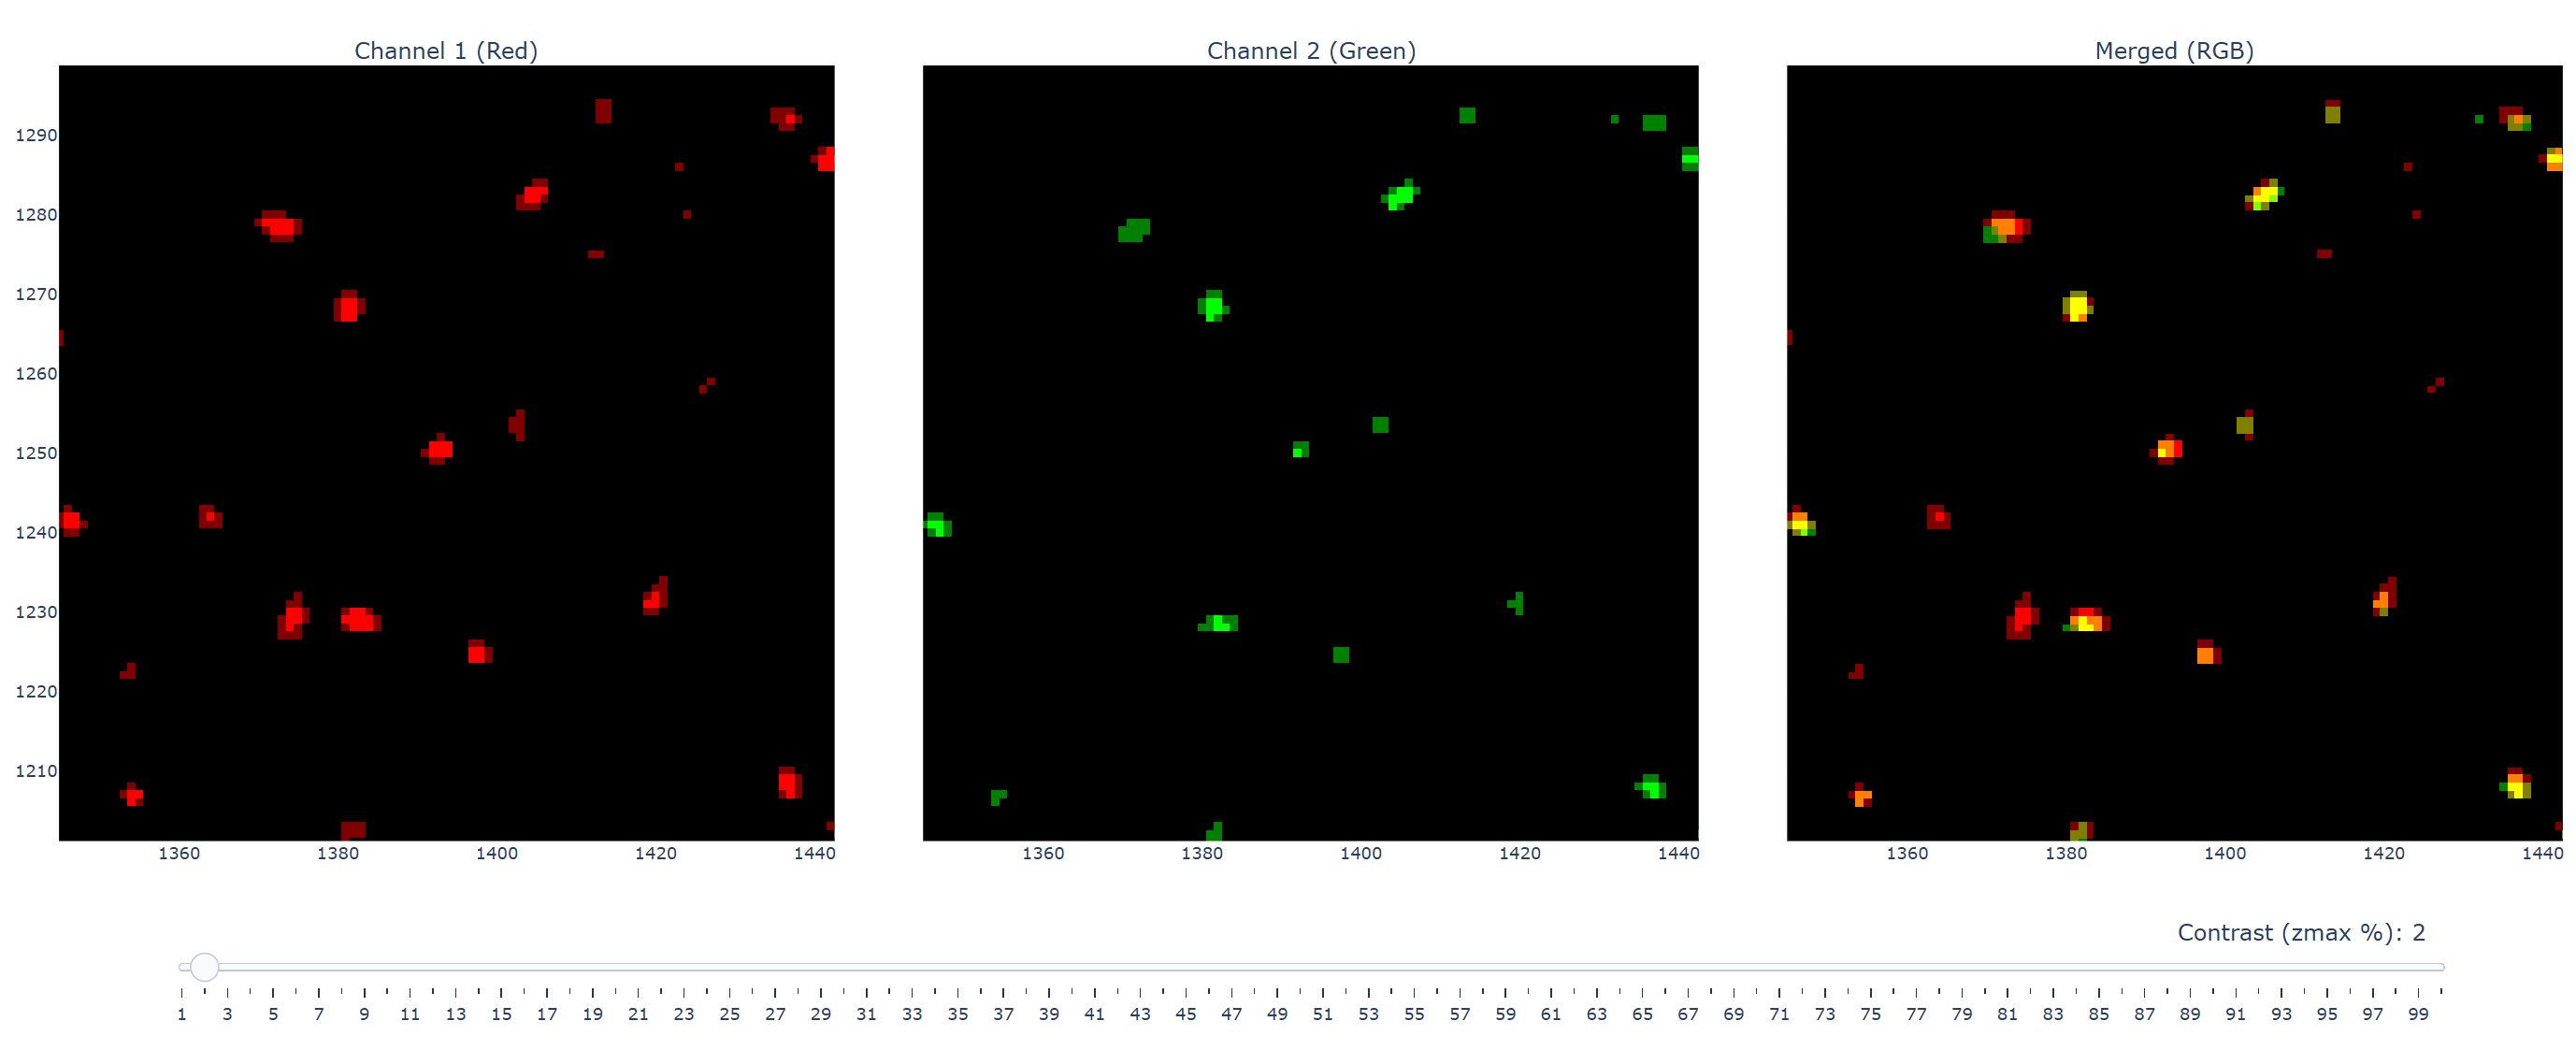
效果如下:
需要注意的是:
-
图像数据会自动转换为 8-bit
-
第一个通道默认使用红色,第二个默认绿色伪彩
-
对比度方面仅支持通过滑块调整显示的最大值,并且按百分比来
-
可以对任意通道或merge子图区域进行同步的zoom in/out
代码如下:
from skimage import ioimport plotly.graph_objects as gofrom plotly.subplots import make_subplotsimport numpy as np
def visualize_channels(ch1, ch2, output_file="channel_visualization.html"): """ Visualize two grayscale images (ch1 and ch2) and their RGB merged image in a single row with three subplots. ch1 uses red colormap, ch2 uses green colormap, merged image uses ch1 as R, ch2 as G, B=0. Non-8-bit inputs are linearly converted to 8-bit based on dtype. A single slider controls zmax for all subplots (mapped from 1-100% to 0-255), with synchronized zooming and 1:1 scale. Subplots are displayed with the same aspect ratio and dimensions as the input images. Tight layout and no axis background for clean display.
Parameters: ch1 (np.array): Grayscale image for channel 1 (R in merged image) ch2 (np.array): Grayscale image for channel 2 (G in merged image) output_file (str): Path to save the output HTML file """ # Convert inputs to 8-bit if not already def to_uint8(arr): arr = np.asarray(arr) if arr.dtype == np.uint8: return arr # Linearly scale to 0-255 based on dtype min and max dtype_info = np.iinfo(arr.dtype) if np.issubdtype(arr.dtype, np.integer) else np.finfo(arr.dtype) arr_min, arr_max = dtype_info.min, dtype_info.max arr = (arr - arr_min) / (arr_max - arr_min) * 255 return np.clip(arr, 0, 255).astype(np.uint8)
ch1 = to_uint8(ch1) ch2 = to_uint8(ch2)
# Get image dimensions img_height, img_width = ch1.shape
# Calculate aspect ratio (width / height) aspect_ratio = img_width / img_height
# Create subplot figure with shared x and y axes for synchronized zooming fig = make_subplots( rows=1, cols=3, subplot_titles=("Channel 1 (Red)", "Channel 2 (Green)", "Merged (RGB)"), shared_xaxes=True, shared_yaxes=True, horizontal_spacing=0.02 # Tight layout: minimize spacing between subplots )
# Define custom colormaps starting from black red_cmap = [[0, "rgb(0,0,0)"], [1, "rgb(255,0,0)"]] green_cmap = [[0, "rgb(0,0,0)"], [1, "rgb(0,255,0)"]]
# Add heatmaps for ch1 (red) and ch2 (green) fig.add_trace( go.Heatmap(z=ch1, colorscale=red_cmap, zmin=0, zmax=255, showscale=False), row=1, col=1 ) fig.add_trace( go.Heatmap(z=ch2, colorscale=green_cmap, zmin=0, zmax=255, showscale=False), row=1, col=2 )
# Create RGB merged image (ch1 as R, ch2 as G, B=0) rgb = np.stack([ch1, ch2, np.zeros_like(ch1)], axis=-1).astype(np.uint8)
# Add RGB image for merged subplot fig.add_trace( go.Image(z=rgb, zmin=[0, 0, 0, 0], zmax=[255, 255, 255, 255], hoverinfo="none"), row=1, col=3 )
# Update axes for synchronized zooming and matching image aspect ratio fig.update_xaxes( matches='x', scaleanchor='y', scaleratio=1, constrain='domain' ) fig.update_yaxes( matches='y', scaleanchor='x', scaleratio=1, constrain='domain' )
# Calculate figure dimensions to match image aspect ratio # Base width per subplot, adjusted for three subplots and minimal margins subplot_width = 600 # Base width per subplot in pixels total_width = subplot_width * 3 + 50 # Account for margins and spacing total_height = subplot_width / aspect_ratio + 150 # Adjust height for aspect ratio + margins
# Add single slider for zmax adjustment for all subplots fig.update_layout( sliders=[ { "active": 99, # Default to 100% (zmax=255) "yanchor": "top", "xanchor": "left", "currentvalue": { "font": {"size": 16}, "prefix": "Contrast (zmax %): ", "visible": True, "xanchor": "right" }, "pad": {"b": 10, "t": 50}, "len": 0.9, "x": 0.05, "y": 0, "steps": [ { "method": "restyle", "label": str(i), "value": str(i), "args": [ { "zmax": [ int((i-1)/99*255), # ch1 (Heatmap) int((i-1)/99*255), # ch2 (Heatmap) [int((i-1)/99*255), int((i-1)/99*255), int((i-1)/99*255)] # RGB (Image) ] }, [0, 1, 2] # Apply to all three traces ] } for i in range(1, 101, 1) ] } ], # Tight layout: minimize margins margin=dict(l=10, r=10, t=50, b=100), # title="Channel Visualization with Contrast Adjustment", width=total_width, height=total_height, showlegend=False )
# Save to HTML fig.write_html(output_file, include_plotlyjs="cdn")
return fig
def test(): ch1 = io.imread('ch1.tif', plugin='pil') ch2 = io.imread('ch2.tif', plugin='pil') frame1 = ch1[5] frame2 = ch2[4] visualize_channels(frame1, frame2)
if __name__=='__main__': test()