点簇状信号在成像数据中非常常见。这里提供一个整合好的函数方便进行分析。
点簇状信号有点类似点状信号,虽然仅占较少的像素区域,但却存在一些不规则的形状(不仅仅是圆形)。这种情况导致常规的find maxima或者 find spot 方法不能比较完整地提取着整个点簇的所有像素。这会导致对cluster间距的统计分析结果偏大,面积偏小。这个时候以maxima作为marker,以阈值区分前景背景的二值化图像计算distance,再应用watershed进行实现不同点簇信号的分割是一个非常经典的做法。废话不多说,先看效果:
label = wat_seg(zone, vmax=500, debug=True)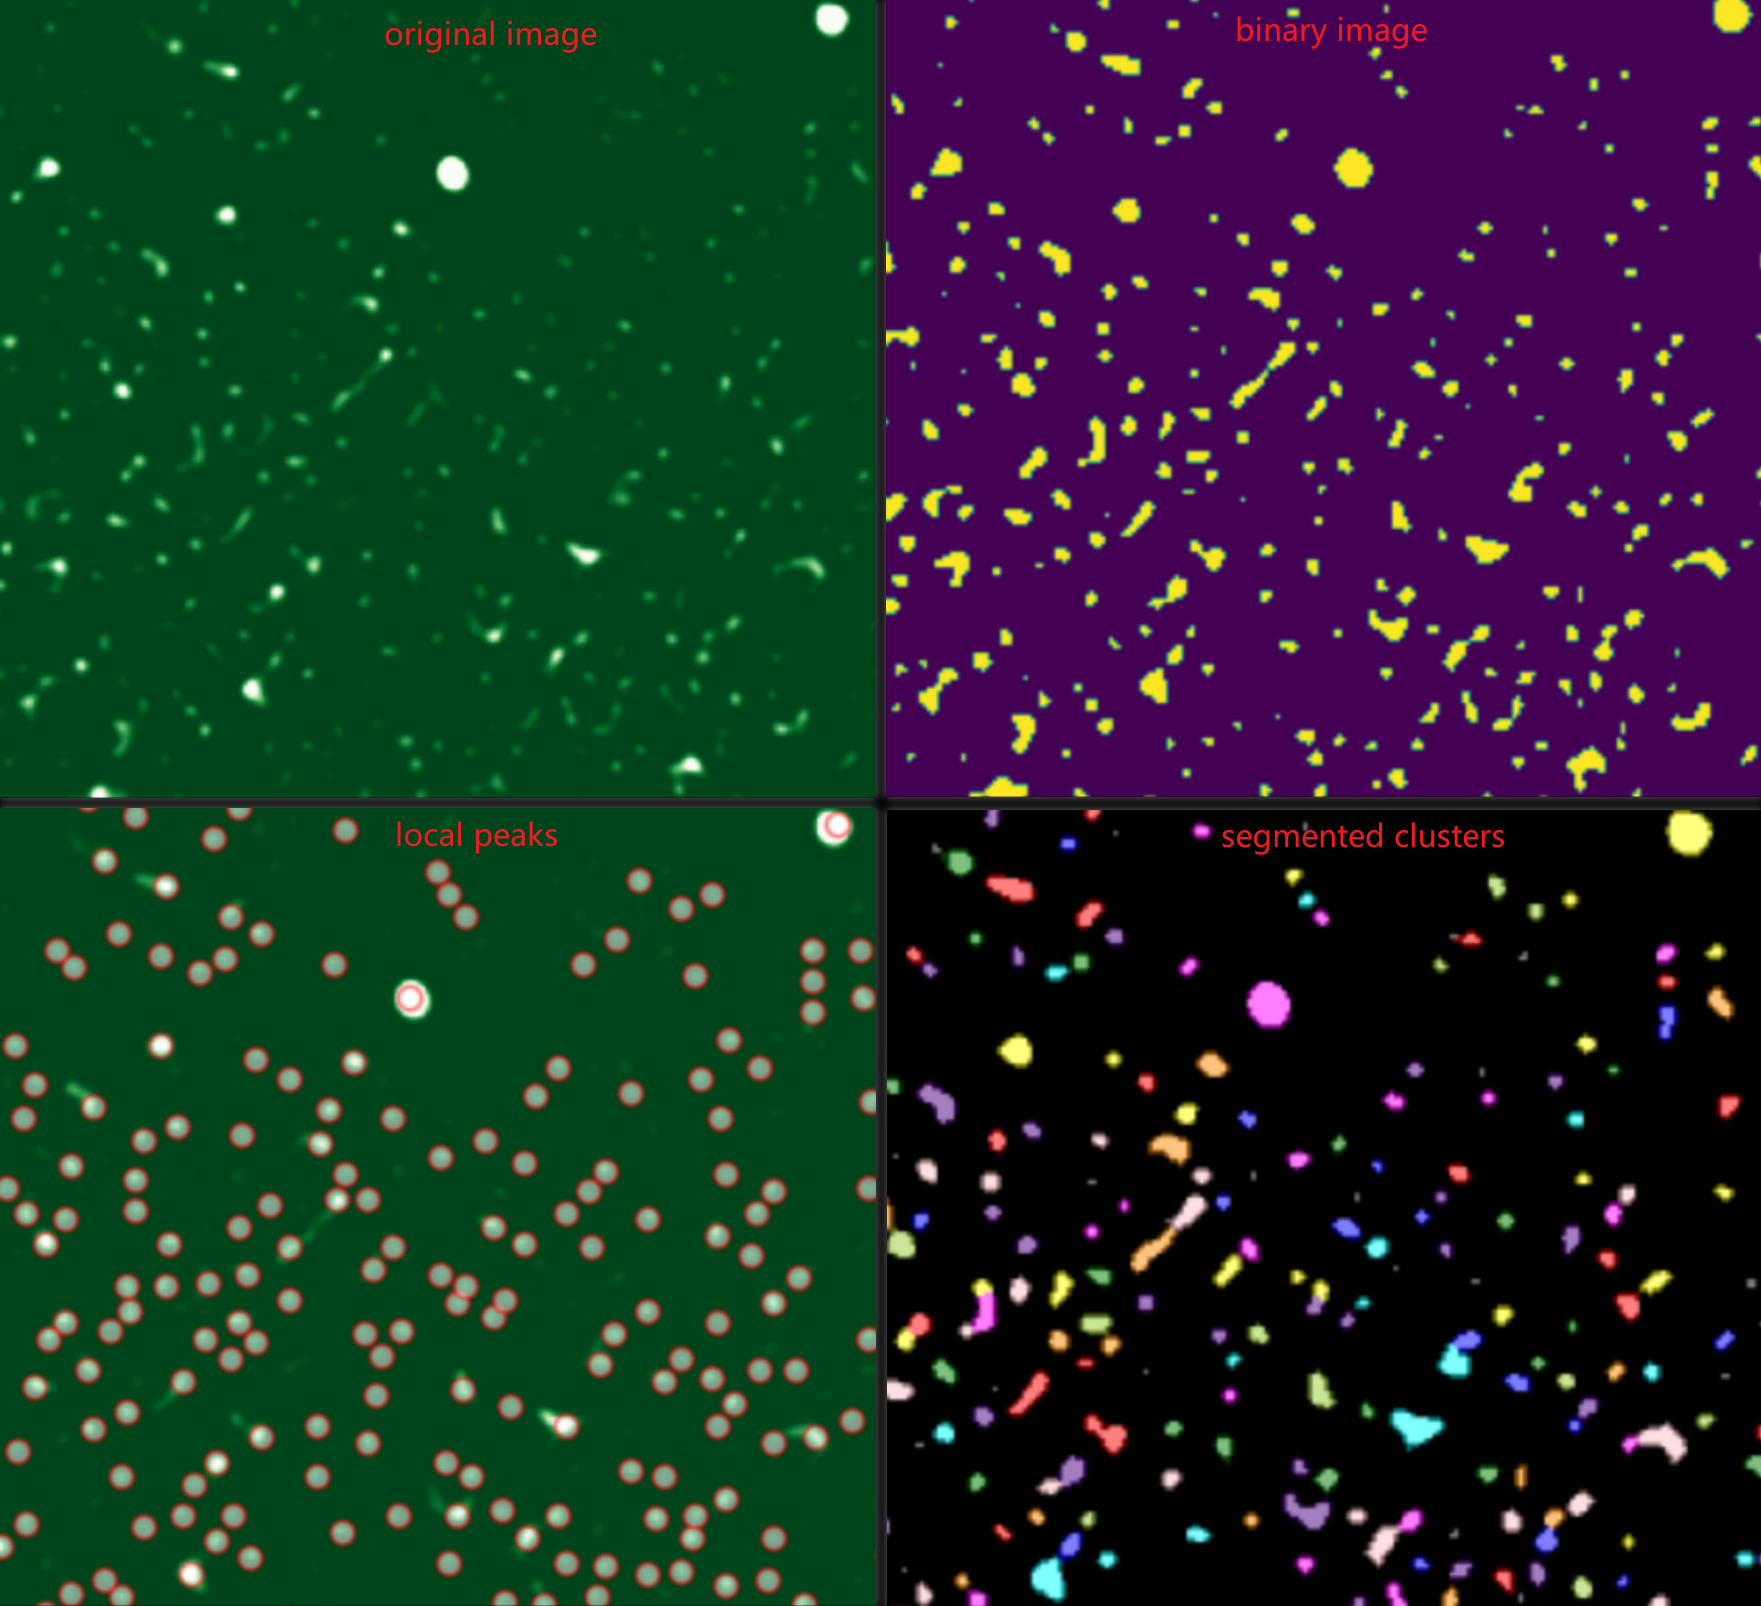
再放代码:
import matplotlib.pyplot as pltfrom skimage import ioimport numpy as npfrom scipy import ndimage as ndifrom skimage.segmentation import watershedfrom skimage.feature import peak_local_maxfrom skimage import filtersfrom skimage.color import label2rgb
import matplotlib as mplmpl.rcParams['font.family'] = 'DengXian'plt.rcParams['axes.unicode_minus'] = False
def wat_seg(zone, threshold, peak_min_distance=3, vmin=10, vmax=1000, debug=False): ''' zone: 二维图像 peak_min_distance: 决定了搜索peak的范围,2*peak_min_distance+1 vmin 和 vmax,仅用于设置合适的对比度,方便在开启debug模式下查看 返回一张label图像,背景为0,目标已按region id 进行赋值, 且为uint16 ''' if debug: plt.figure(figsize=(10, 10)) plt.imshow(zone, vmin=vmin, vmax=vmax, cmap='Greens_r') plt.title(f'Original image') plt.show() # 图像二值化 binary = zone>threshold if debug: plt.figure(figsize=(10, 10)) plt.imshow(binary) plt.title(f'binary_threshold={threshold}') plt.show() # 距离变换 distance = ndi.distance_transform_edt(binary) # 准备标记点 coords = peak_local_max(zone, min_distance=peak_min_distance, threshold_abs=threshold) markers = np.zeros(shape=zone.shape, dtype=np.int32)
# 将局部极大值位置设置为前景标记点 # 我们从标签 2 开始标记前景(标签 1 保留给背景,标签 0 是未确定区域) # 使用 enumerate 为每个局部极大值赋予唯一的标签 for i, coord in enumerate(coords): markers[coord[0], coord[1]] = i + 2 # 标签从 2, 3, 4... 开始 # 确定“确定无疑的背景”区域,直接设定阈值 inds = np.where(zone<=threshold) markers[inds] = 1 # 将确定背景区域设置为标签 1 if debug: plt.figure(figsize=(10, 10)) plt.imshow(zone, vmin=vmin, vmax=vmax, cmap='Greens_r') plt.scatter(coords[:,1], coords[:,0], marker='+', color='red', alpha=0.5) plt.title("peak_local_max") plt.show() # 应用分水岭算法 labels = watershed(-distance, markers) if debug: plt.figure(figsize=(10, 10)) res = label2rgb(label=labels, image=binary, bg_label=1, bg_color='black', alpha=0.5) plt.imshow(res) plt.title("watershed segmentation") plt.show() rlabel = labels - 1 rlabel = rlabel.astype('uint16') return rlabel由于这个函数有参数如threshold需要调试确定,为了方便检查,在调试的时候可将debug=True。